Force-directed layout with clean cluster rendering at
Force-directed layout with clean cluster rendering at high topic counts
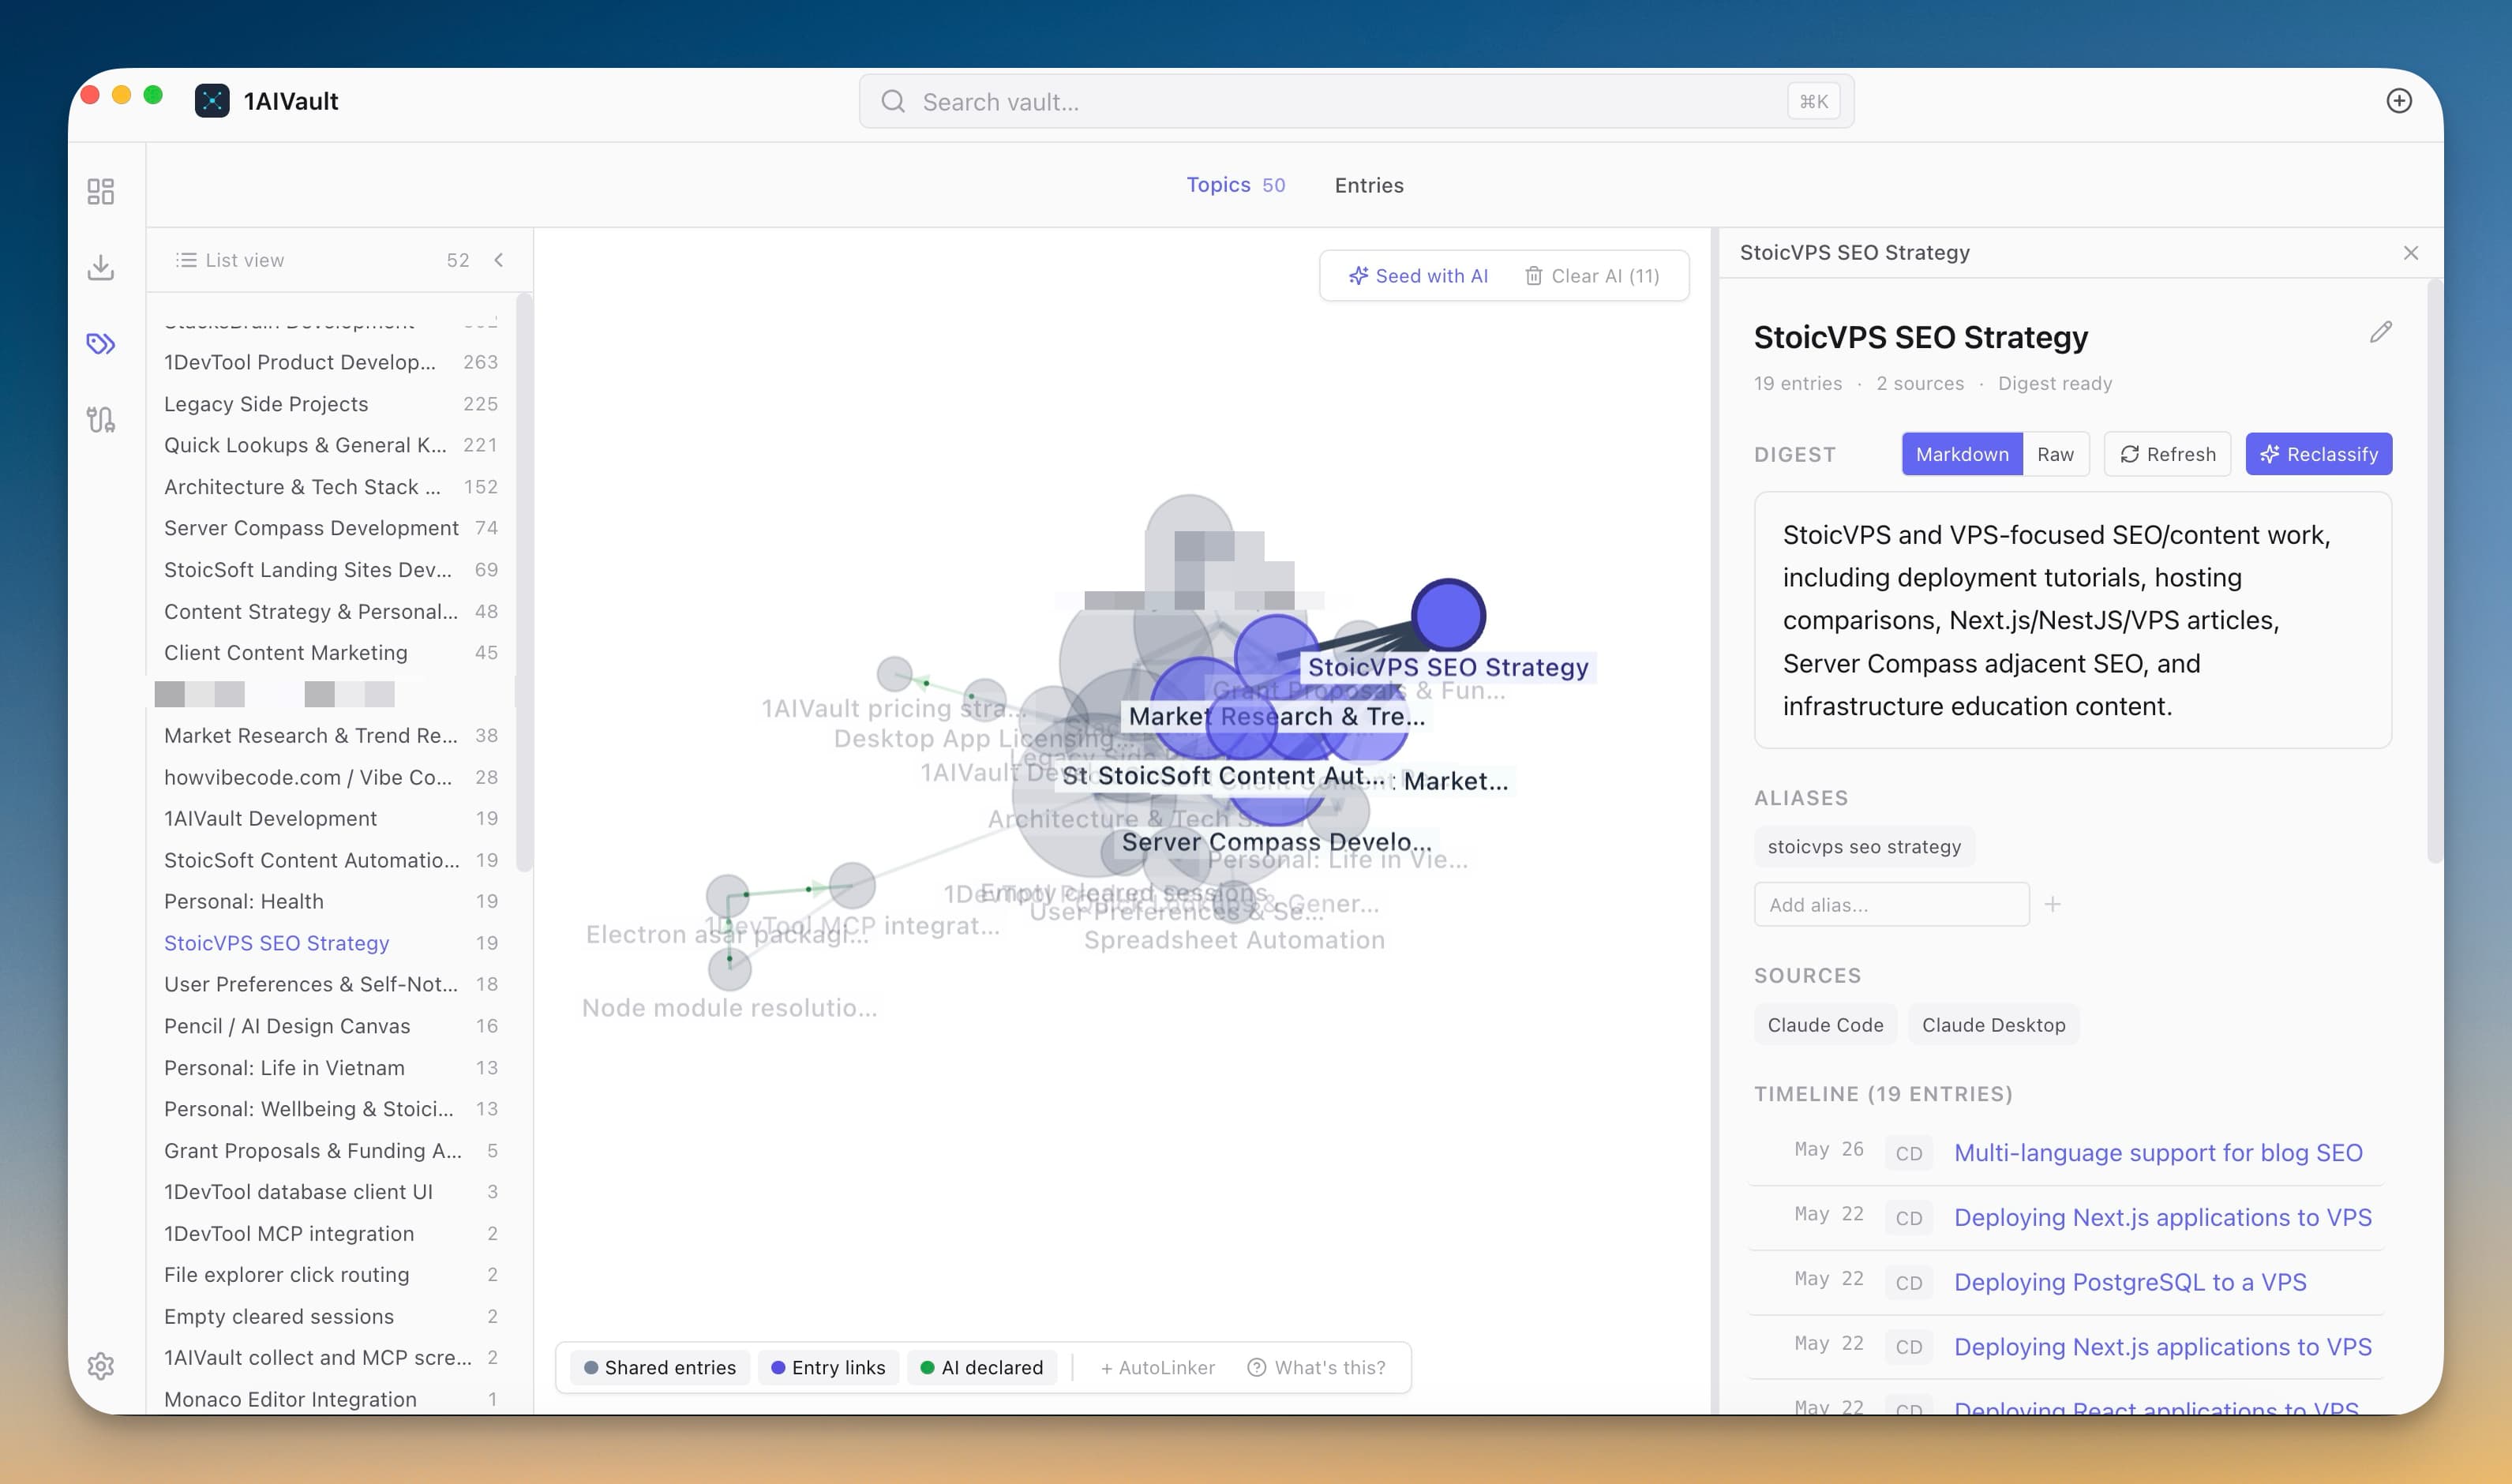
Visualise the shape of your vault as a force-directed graph — clusters of related topics, lines between topics that appear together, and drill-down into any node for the topic digest.
Visualise the shape of your vault as a force-directed graph — clusters of related topics, lines between topics that appear together, and drill-down into any node for the topic digest.
Seeing your context as a map exposes connections you didn't know existed and clusters that map to the projects you've been thinking through. It's the difference between a list of memories and an atlas of what you've been working on.
Force-directed layout with clean cluster rendering at high topic counts
Click any topic to open its digest in a side panel
Cross-link lines show which topics appear together often
Filter the graph by topic count, recency, or source
Open the Classify view and switch to Graph mode.
Explore clusters to see how topics group together.
Follow edges to trace shared entries and declared relationships between topics.
Review AutoLinker proposals to surface connections you did not set up manually.
It means at least one entry is classified under both topics. The thicker the line, the more entries share both.
Point 1AIVault at a local Ollama model and it extracts topics from your entries, merges duplicates, and groups related memories — cross-classification across topics is the default.
Learn moreA 3-step wizard that picks an AI client, confirms the MCP connection, and seeds your vault from existing chats — with project pickers for Claude Code and Cursor.
Learn moreEach topic can carry a digest that is viewable as Markdown or raw text, editable, refreshable, and classifiable again.
Learn moreStart free, import real conversations, and reuse your memory across every AI agent you already use.